

Chrome Devtool
Module Federation Devtools lets you inspect Federation modules, dependency relationships, and shared dependencies on a page. You can also proxy remote modules to a local or specific version and trace the module loading process.
The visualization and proxy features require mf-manifest.json.
Use in different browsers
Module Federation Devtools is a Chrome extension with two versions for different browser environments. Both versions provide the same debugging features; only their installation and entry points differ:
Both versions support module proxying and version switching, module information, dependency graphs, shared dependencies, React HMR / Fast Refresh, Loading Trace, report export, and WebMCP.
Enable only one version in the same browser to avoid duplicate injection.
The two versions above are designed for interactive browser environments. For headless browsers or CI automation, use Divebell with its Module Federation Extension.
Divebell can load pages through its CLI, collect Module Federation runtime information, and return structured diagnostic results without opening an extension UI. See Diagnose runtime issues with Divebell for installation and usage.
Installation
Desktop Chrome
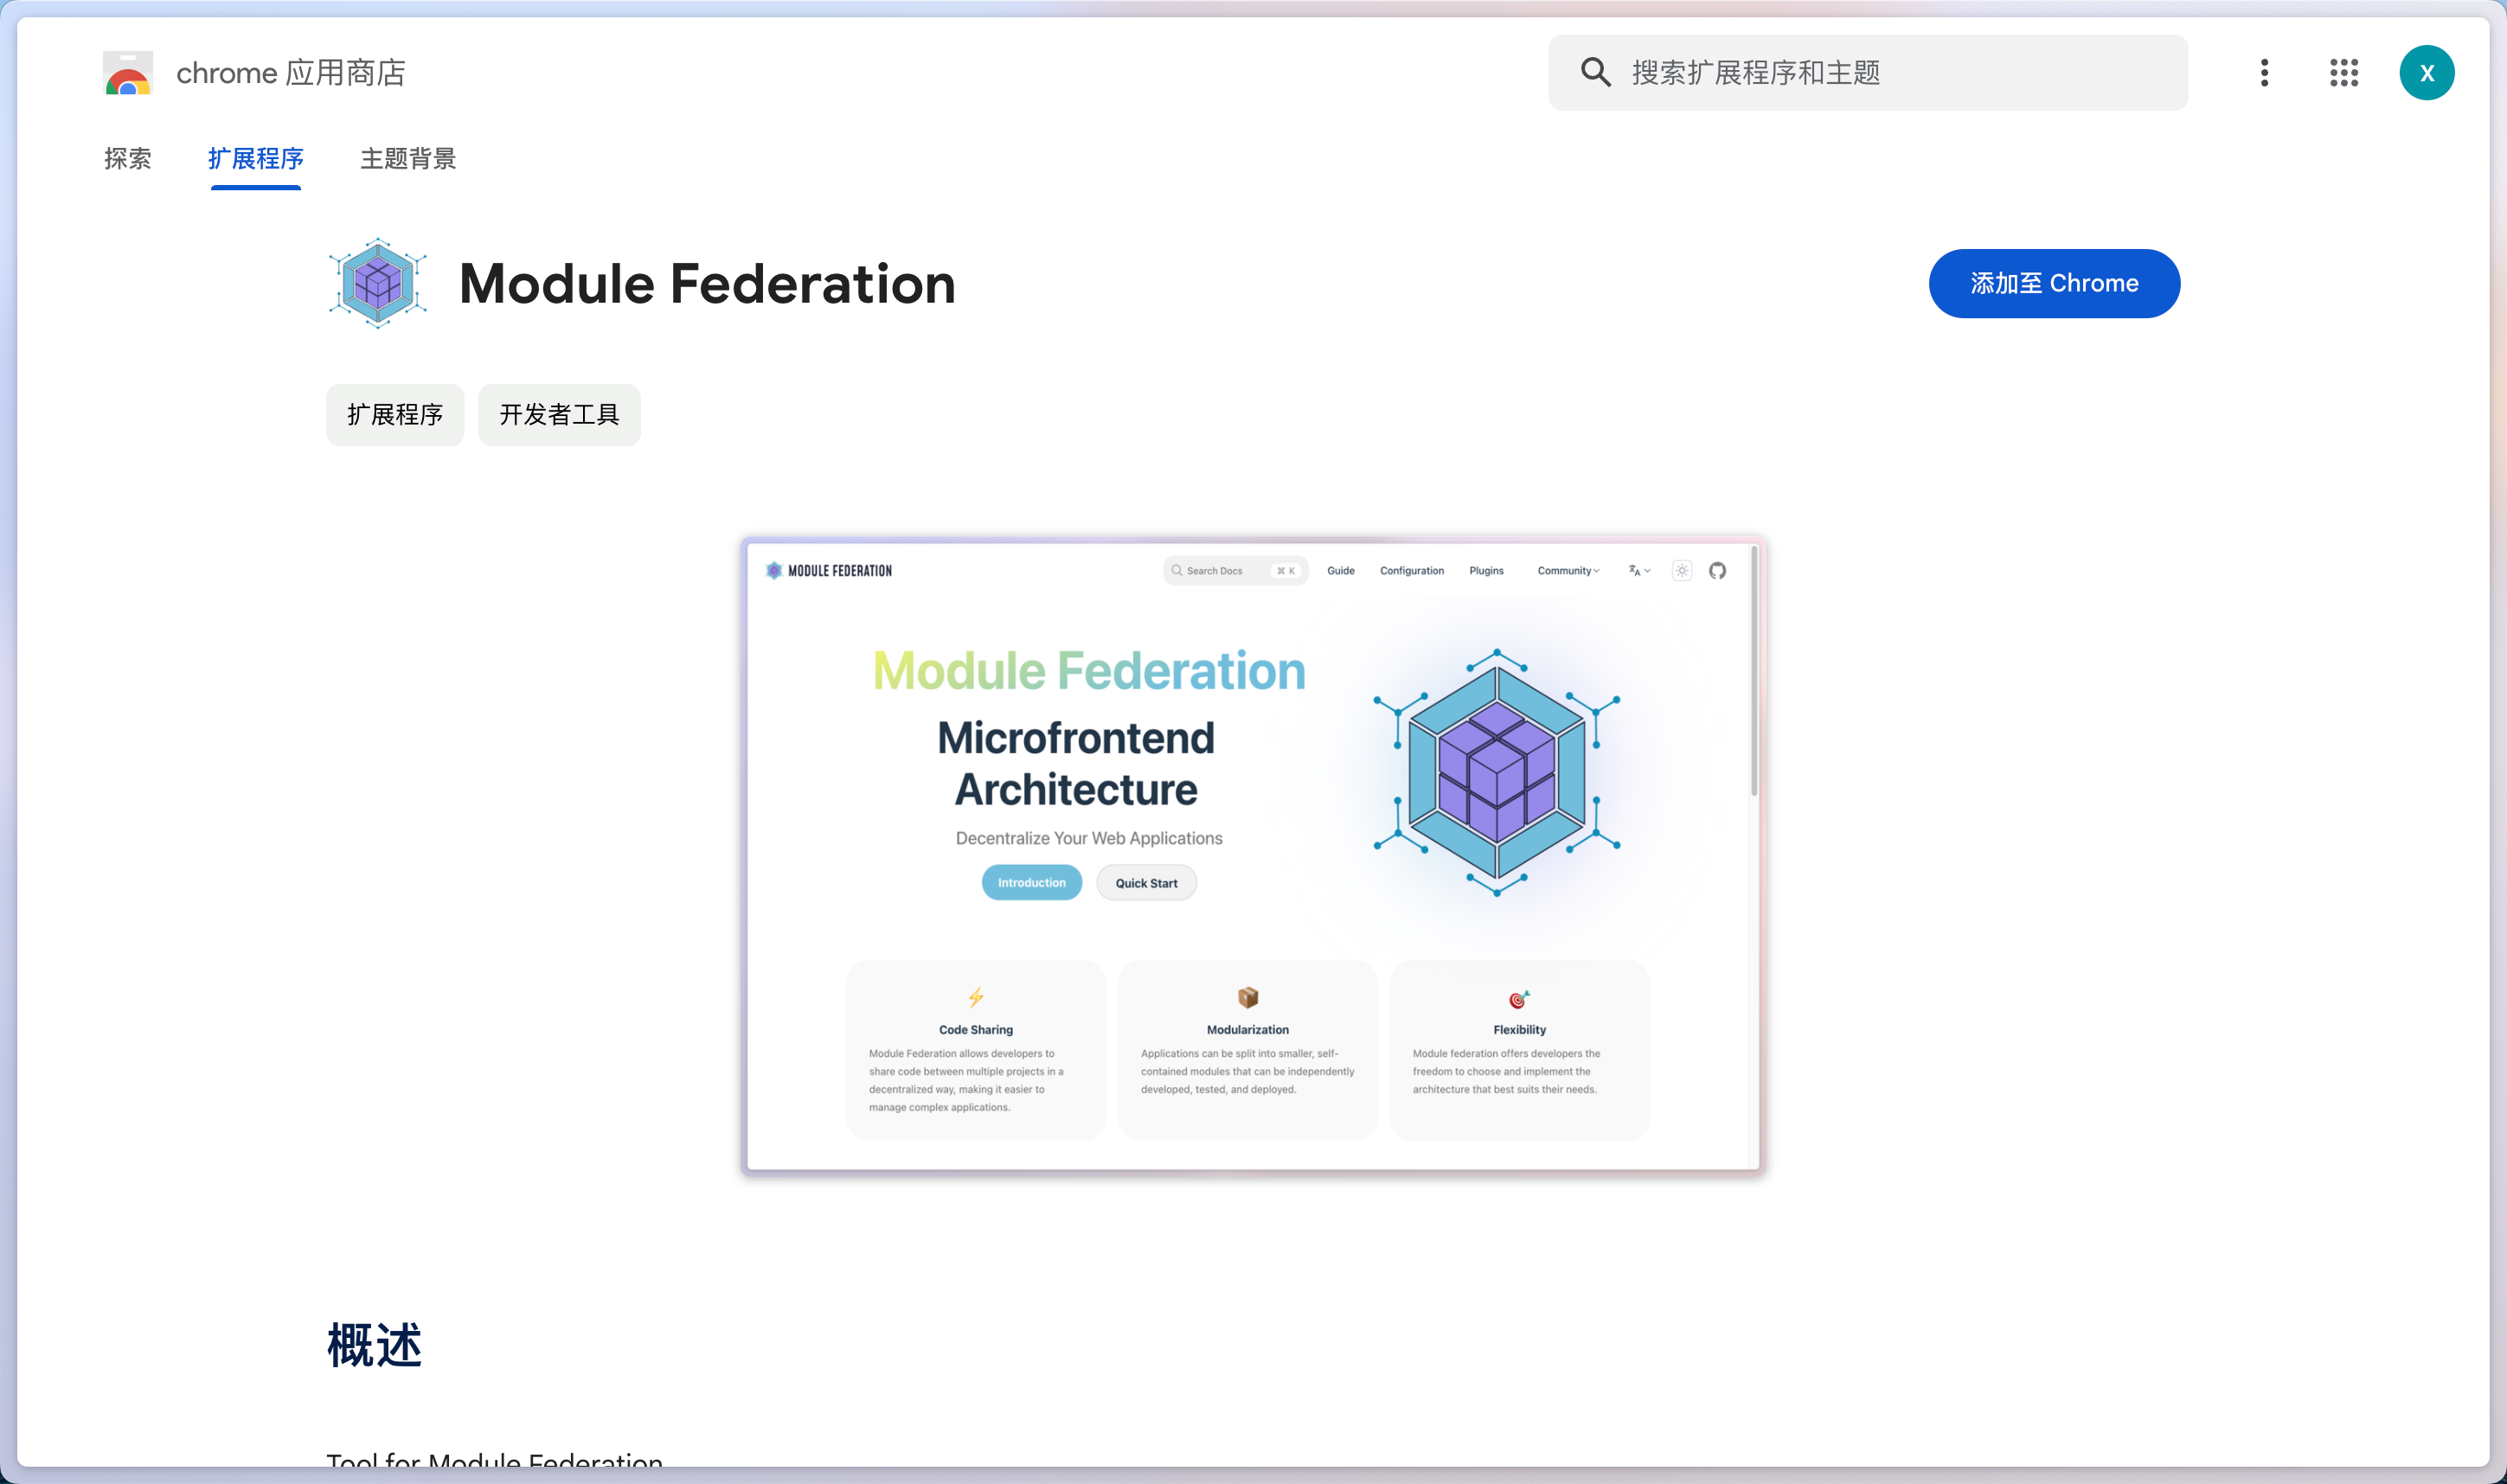
Open the Module Federation extension page and click Add to Chrome.
Embedded browser
- Open Module Federation Releases and download the Browser ZIP from the Assets section of a stable release. Do not download GitHub's automatically generated Source code archives.
- Extract the ZIP and load the extracted directory from the embedded browser's extension manager.
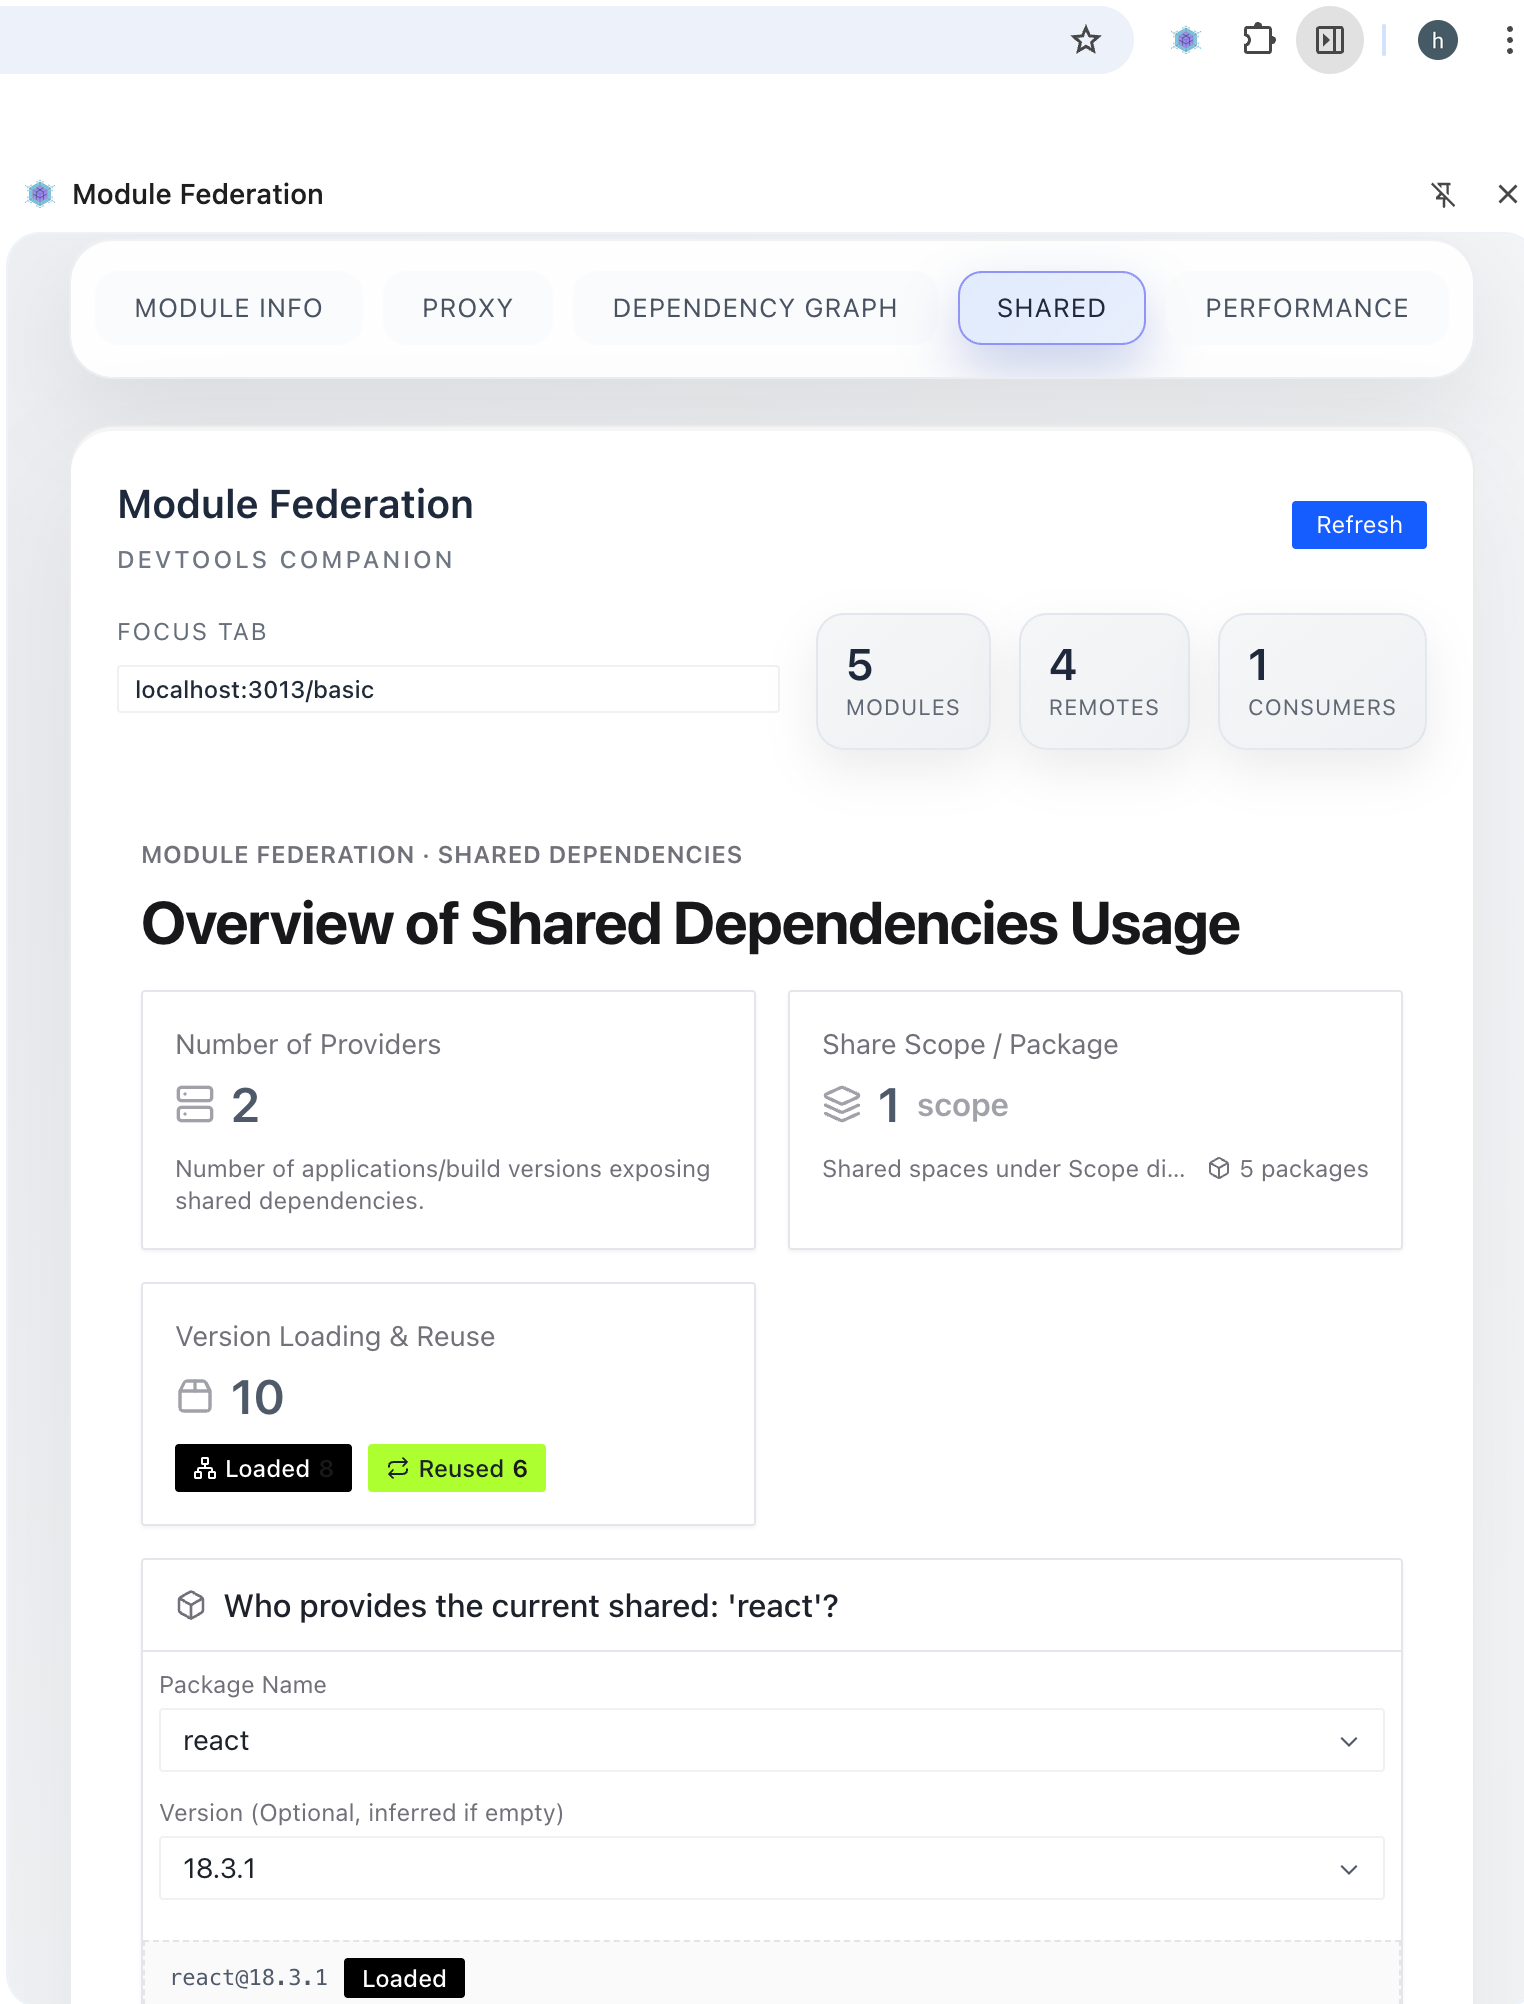
- Open or refresh the target page, then click the extension icon.
Browser assets are published for latest stable releases. next previews do not create GitHub Releases. If the target release has no Browser asset, run:
Then load packages/chrome-devtools/dist/browser. After updating the extension, reload it and refresh any open pages.
Features
Use the extension
In desktop Chrome, open the target page, press F12, and select Module Federation in DevTools. In an embedded browser, click the extension icon.

Proxy a module
- Select the module to proxy in the Proxy panel.
- Select a target version, or enter a local port or full
mf-manifest.jsonURL, such ashttp://localhost:3000/mf-manifest.json. - To proxy multiple modules, click
add new proxy moduleto add another rule. - Save the configuration and refresh the page.
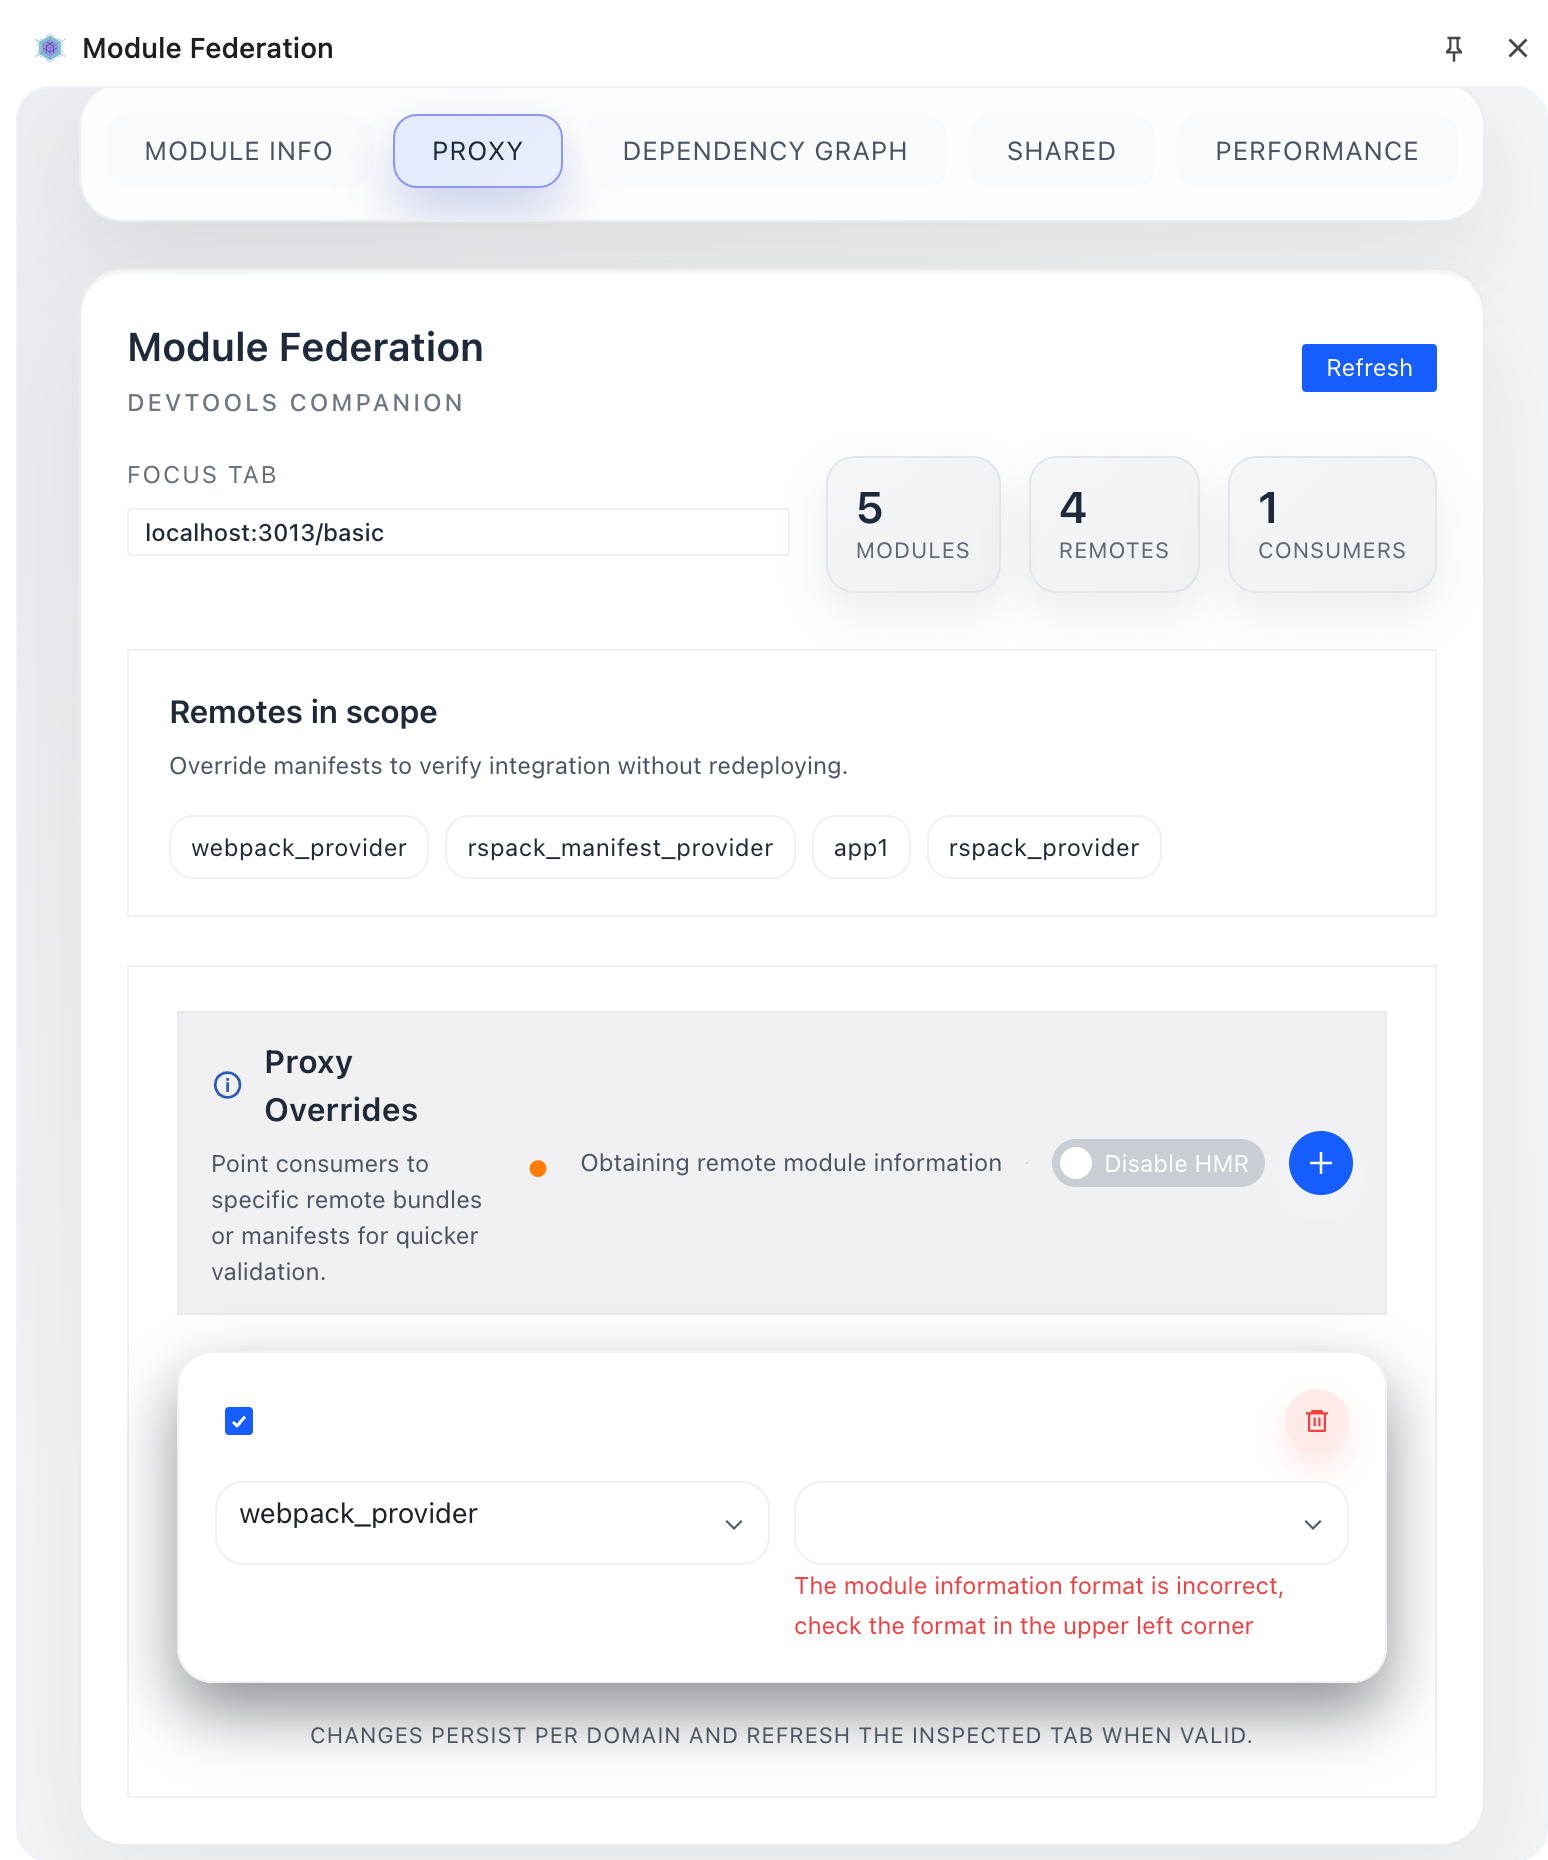
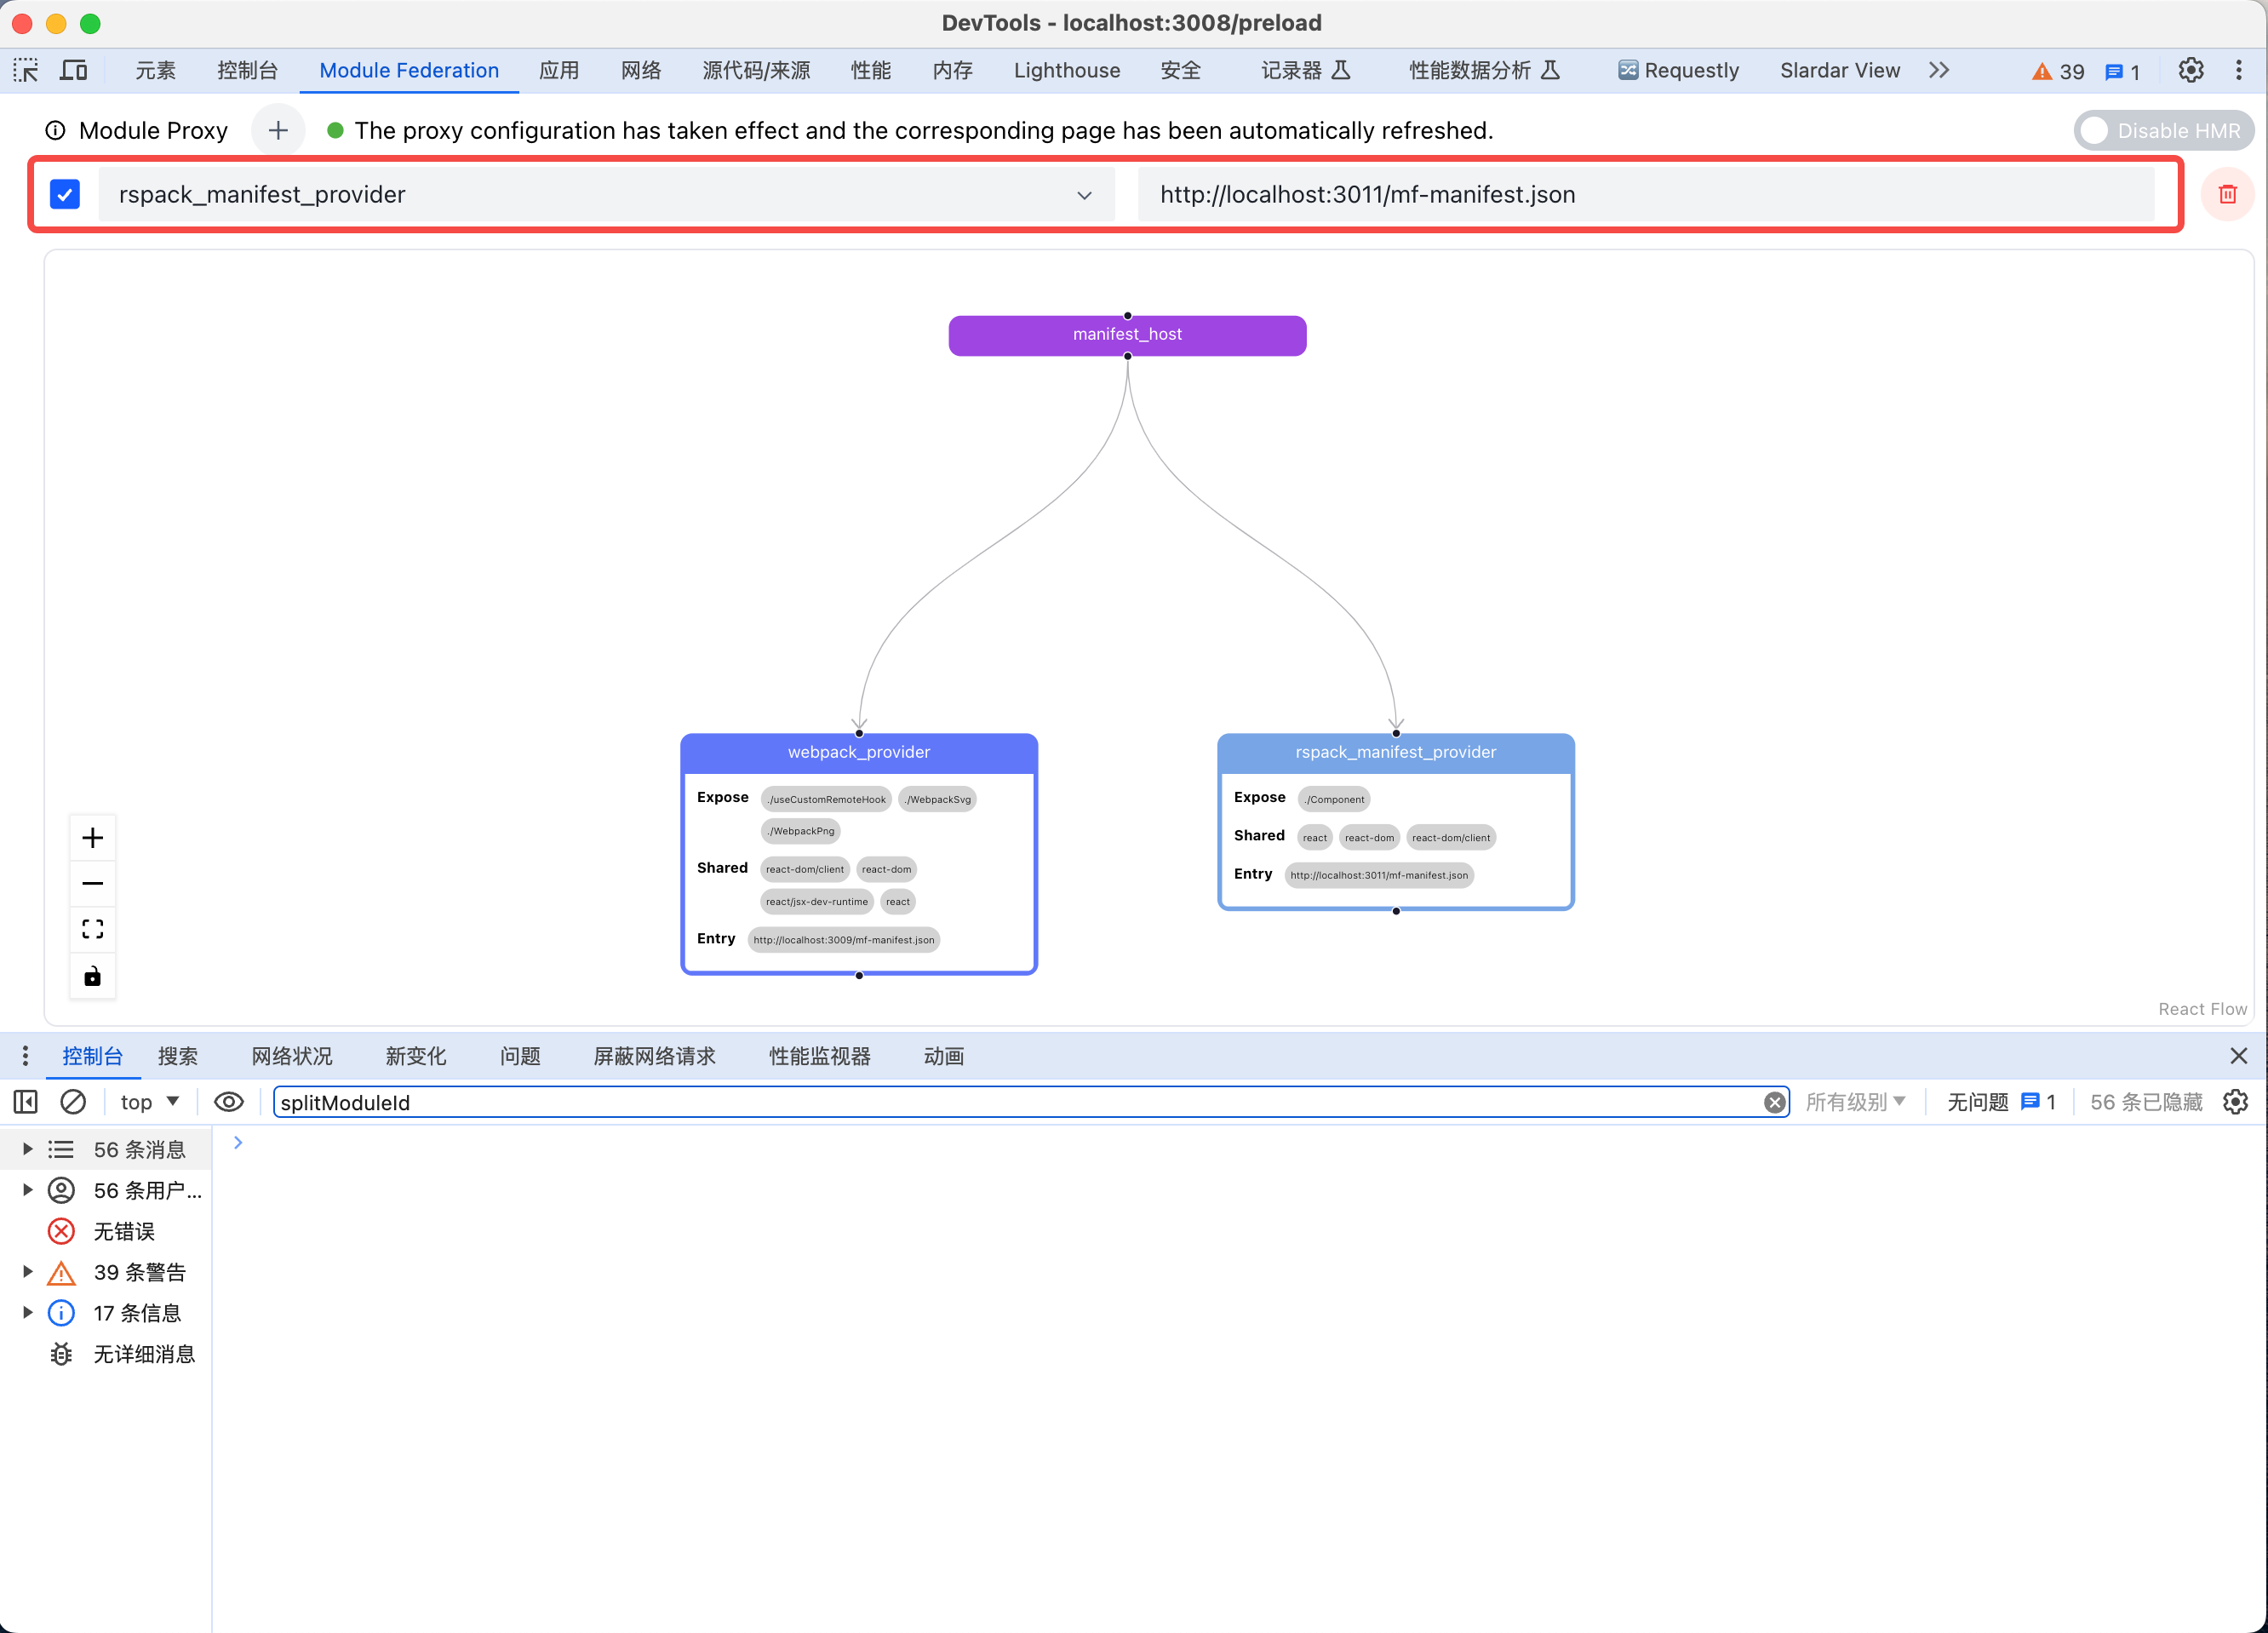
For local development, start the producer first and enter its manifest URL in the proxy rule. The consumer page reloads automatically when you update the producer code.

Loading Trace
Loading Trace helps diagnose blank pages, components stuck in loading, unexpected shared versions, and producer loading failures.
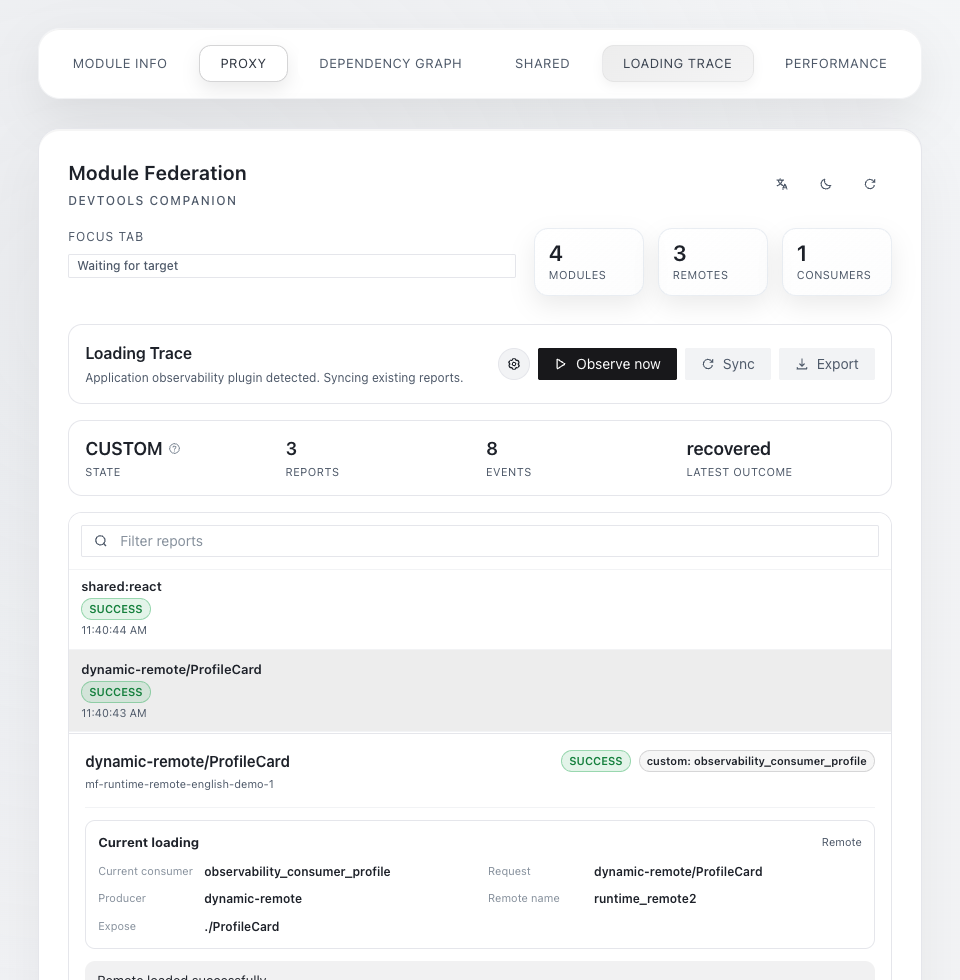
Panel states:
OFF: no readable loading report is available on the current page.ON: the extension is collecting data for the current tab.CUSTOM: the page uses the Observability Plugin, and Devtools is reading its reports.
To trace a load:
- Open Loading Trace. If the state is
OFF, clickObserve now; the page reloads once. - Reproduce the issue or trigger the remote component load you want to inspect.
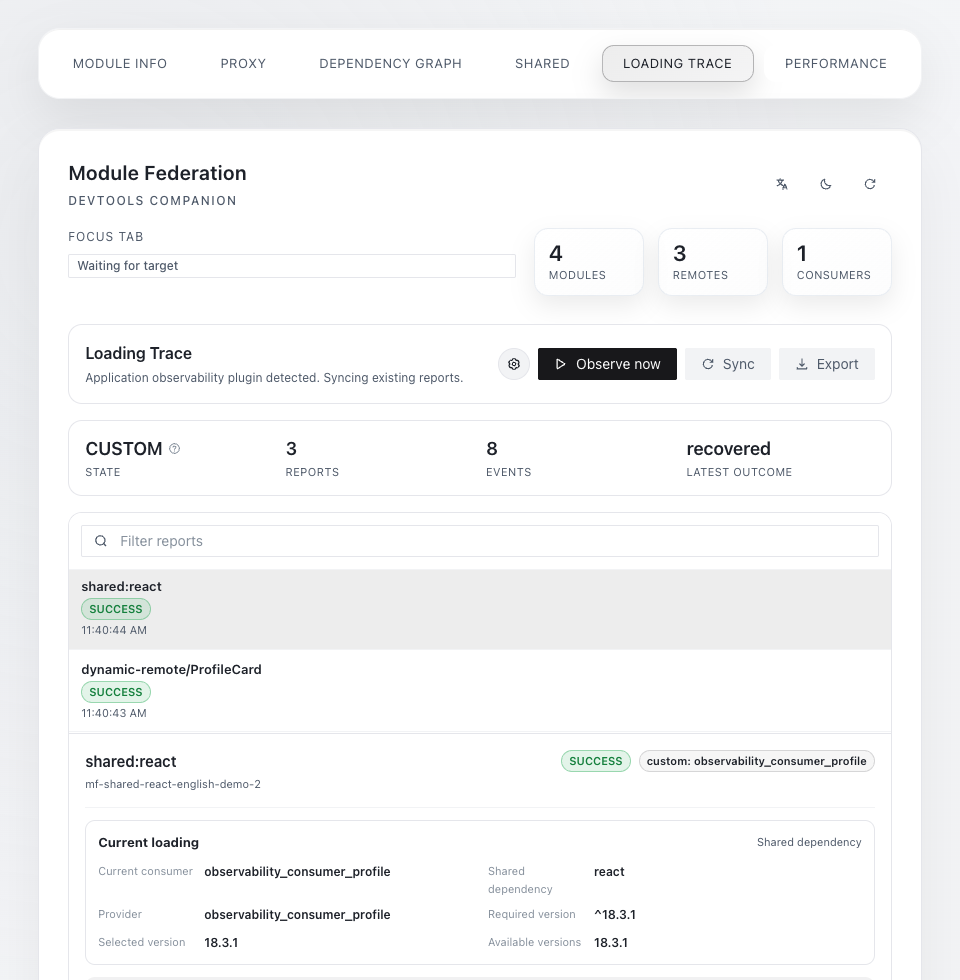
- Select a report and inspect the result, event timeline, failure stage, and suggested actions.
- Click
Exportto save the complete report.
The main report states are success, failure, pending, and recovered. The exported JSON contains config, scopes, and reports. Focus on:
diagnosis: the conclusion, evidence, and suggested actions.summary: the final loading state.remote/shared: the loaded target, provider, and version details.loadedBefore: whether another consumer had already loaded the same producer.events: the complete event sequence.
Work with a coding agent through WebMCP
WebMCP support for desktop Chrome is currently under review for release on the Chrome Web Store. Until the review is complete, the store version does not support the features described in this section.
Both extension versions automatically register WebMCP tools when the page starts. The extension UI does not need to remain open, and the application does not need an additional WebMCP SDK.
For example, ask a WebMCP-capable agent:
mf_set_proxy replaces the complete proxy rule list, so read the current state before making changes. Configuration tools return reloadRequired; the agent should reload the page based on that result.
Graph layout, filtering, theme, and language remain UI operations. For deeper analysis of runtime errors or performance bottlenecks, use Divebell.
Notes
- The extension does not bypass CSP, CORS, or browser network restrictions. Proxying from an HTTPS page to a local HTTP service still requires compatible page policies, protocols, and cross-origin response headers.
- Proxy, HMR, and Loading Trace settings are stored in the page origin's localStorage. Same-origin tabs may share settings. Use different origins or separate browser profiles when you need conflicting configurations.
- If an agent cannot discover the WebMCP tools, reload the extension and refresh the page, then inspect
window.__MF_DEVTOOLS_WEBMCP__in the console.registeredmeans registration succeeded,unavailablemeans the host did not provide a usable API, anderrorcontains the specific cause.